Tag: income inequality
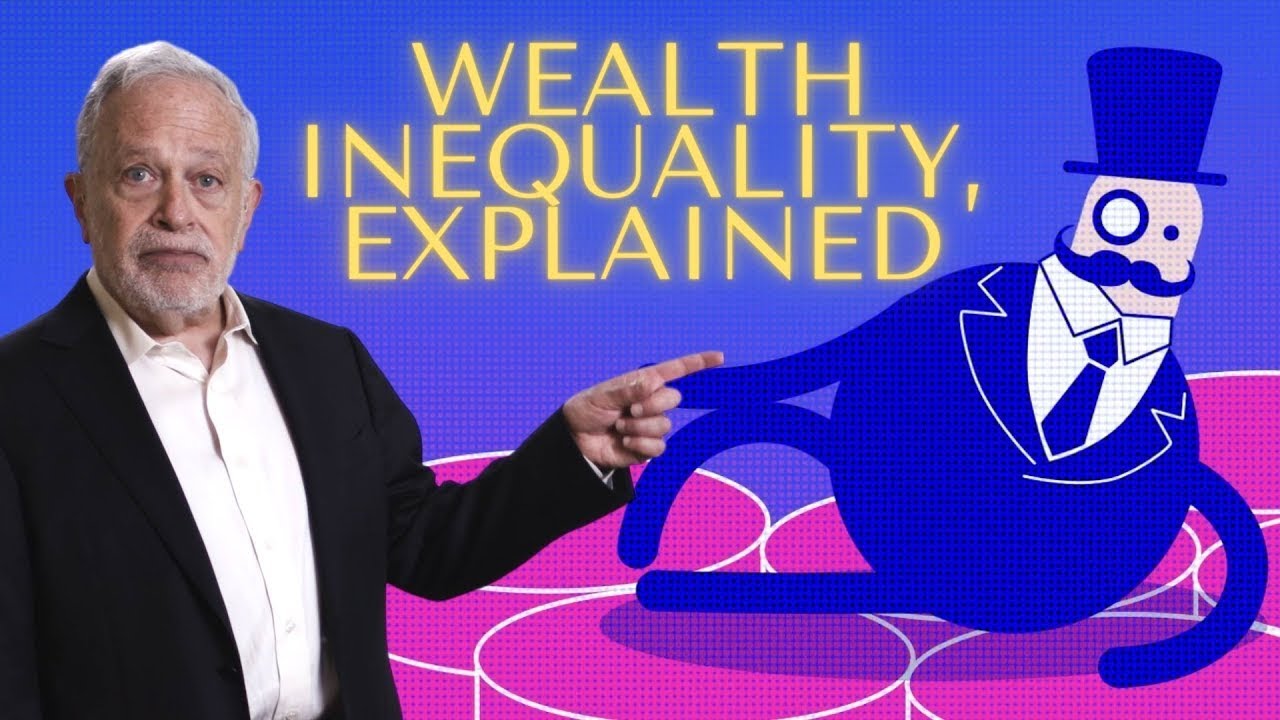
How Wealth Inequality Spiraled Out of Control | Robert Reich
Jason 0 Comments Retire Wealthy
Elon Musk's wealth has surpassed $200
billion. It would take the median U.S. worker OVER 4 MILLION YEARS to make that much.
Wealth inequality is eating this country alive. We’re now in America’s second Gilded Age, just like the late 19th century when a handful
of robber barons monopolized the economy kept wages down, and bribed lawmakers. While today’s robber barons take joy rides
into space, the distance between their gargantuan wealth and the financial struggles
of working Americans has never been clearer. During the first 19 months of the
pandemic, U.S. billionaires added $2.1 TRILLION dollars to their collective wealth. And the rich have enough political power to cut their taxes to almost nothing
— sometimes literally nothing. In fact, Jeff Bezos paid no federal
income taxes in 2007 or in 2011. By 2018, the 400 richest Americans paid a
lower overall tax rate than almost anyone else. But we can't solve this problem unless we
know how it was created in the first place. Let’s start with the basics. Wealth inequality in America is
far larger than income inequality. "Income" is what you earn each week or month or
year.
"Wealth" refers to the sum total of your assets — your car, home, art — anything else
you own that’s valuable. Valuable not only because there’s
a market for it — a price other people are willing to pay to buy it — but because wealth itself grows. As the population expands and the
nation becomes more productive, the overall economy continues to expand. This
expansion pushes up the values of stocks, bonds, rental property,
homes, and most other assets. Of course recessions and occasional depressions
can reduce the value of such assets. But over the long haul, the value
of almost all wealth INCREASES. Next: personal wealth comes from two sources. The first source is the income you earn
but don’t spend. That’s your savings. When you invest those savings in stocks,
bonds, or real property or other assets, you create your personal wealth, which,
as we’ve seen, grows over time.
The second source of personal wealth is whatever
is handed down to you from your parents, grandparents, and maybe even generations
before them — in other words, what you INHERIT. The wealth gap between the richest
Americans and everyone else is staggering. In the 1970s, the wealthiest 1% owned about
20% of the nation’s total household wealth. Now, they own OVER 35%.
Much of their gains over the last 40 years have come from a dramatic
increase in the value of shares of stock. For example, if someone invested $1,000 in 1978 in
a broad index of stocks — say, the S&P 500 — they would have $31,823 today, adjusted for inflation. Who's benefited from this surge? The richest 1%, who now own
HALF of the entire stock market. But the typical worker’s wages have
barely grown. Most Americans haven’t earned nearly enough to save anything. Before the pandemic, when the economy appeared to be doing well, almost 80% were living paycheck to paycheck. So as income inequality has widened, the
amount that the few high-earning households save — their wealth — has continued to grow.
Their growing wealth has allowed them to pass on more and more wealth to their heirs. Take, for example, the Waltons
— the family behind the Walmart empire — which has seven heirs on the Forbes billionaires list.
Their children, and other rich
millennials, will soon consolidate even more of the nation’s wealth. America is
now on the cusp of the largest intergenerational transfer of wealth in history.
As wealthy boomers pass on, somewhere between $30 to $70 TRILLION will go
to their children over the next three decades. These children will be able to
live off of this wealth, and then leave the bulk of it — which will continue
growing — to their own children … tax-free. After a few generations of this,
almost all of America’s wealth could be in the hands of a few thousand families. Concentrated wealth is already
endangering our democracy. Wealth doesn’t just beget more
wealth — it begets more POWER.
Dynastic wealth concentrates power into
the hands of fewer and fewer people, who can choose what nonprofits and charities
to support, and which politicians to bankroll. This gives an unelected elite enormous sway
over both our economy and our democracy. We might come to resemble the kind of dynasties
common to European aristocracies in the seventeenth, eighteenth, and nineteenth centuries.
Dynastic wealth makes a mockery of the idea that America is a meritocracy, where anyone can
make it on the basis of their own efforts. It also runs counter to the basic economic ideas
that people earn what they’re worth in the market, and that economic gains
should go to those who deserve them.

Finally, wealth concentration magnifies gender and
race disparities because women and people of color tend to make less, save less, and inherit less. The typical single woman owns only 32 cents of wealth for every dollar of wealth owned by a man. The pandemic likely increased this gap. The racial wealth gap is even
starker. The typical Black household owns just 13 cents of wealth for every dollar
of wealth owned by the typical white household. The pandemic likely increased this gap, too.
In all these ways, dynastic wealth creates a self-perpetuating aristocracy that runs
counter to the ideals we claim to live by. The last time America faced anything
comparable to the concentration of wealth we face today was at the turn of the 20th century. That was when President Teddy Roosevelt warned
that “a small class of enormously wealthy and economically powerful men, whose chief
object is to hold and increase their power,” could destroy American democracy.
Roosevelt’s answer then was to tax wealth. Congress enacted two kinds of wealth taxes. The first, in 1916, was the estate tax — a tax on the wealth someone has
accumulated during their lifetime, paid by the heirs who inherit that wealth.
The second tax on wealth, enacted in 1922, was a capital gains tax — a tax on the increased
value of those assets, paid when those assets are sold.
But both of these wealth taxes have shrunk
since then, or become so riddled with loopholes that they haven’t been able to prevent a
new American aristocracy from emerging. The Trump Republican tax cut enabled individuals
to exclude $11.18 million from their estate taxes. That means ONE COUPLE can pass on more
than $22 million to their kids tax-free. Not to mention the very rich often find ways
around this tax entirely. As Trump’s former White House National Economic Council director Gary Cohn
put it, “Only morons pay the estate tax.” What about capital gains on the soaring
values of wealthy people’s stocks, bonds, mansions, and works of art?
Here, the biggest loophole is something called the stepped-up basis.
If the wealthy hold on to their
assets until they die, their heirs inherit them without paying any capital gains taxes whatsoever.
All the increased value of those assets is simply erased, for tax purposes. This loophole
saves heirs an estimated $40 billion a year. This means that huge accumulations of wealth
in the hands of a relatively few households can be passed from generation to generation
untaxed — growing along the way — generating comfortable incomes for rich descendants who
will never have to work a day of their lives. That’s the dynastic class
we’re creating right now. Why have these two wealth taxes eroded?
Because, as America’s wealth has concentrated in fewer and fewer hands, the wealthy have more
capacity to donate to political campaigns and public relations — and they’ve used that
political power to reduce their taxes. It’s exactly what Teddy Roosevelt
feared so many years ago. So what do we do? Follow the wisdom of Teddy
Roosevelt and tax great accumulations of wealth. The ultra-rich have benefited from the American
system — from laws that protect their wealth, and our economy that enabled them to
build their fortunes in the first place. The majority of Americans, both Democrats and Republicans, believe the
ultra-rich should pay higher taxes. There are many ways to make them do so: Closing the stepped up basis loophole, raising
the capital gains tax, and fully funding the Internal Revenue Service so it can properly
audit the wealthiest taxpayers, for starters.
Beyond those fixes, we need a new wealth
tax: a tax of just 2% a year on wealth in excess of $1 million.
That’s hardly a drop in the bucket for centi-billionaires like Jeff Bezos and Elon Musk,
but it would generate plenty of revenue to invest in healthcare and education so that millions
of Americans have a fair shot at making it. One of the most important things you as an
individual can do is take the time to understand the realities of wealth inequality in America
and how the system has become rigged in favor of those at the top — and demand your political
representatives take action to unrig it. Wealth inequality is worse
than it has been in a century. We have to stop this vicious cycle — and demand an
economy that works for the many, not one that concentrates more and more wealth
in the hands of a privileged few.
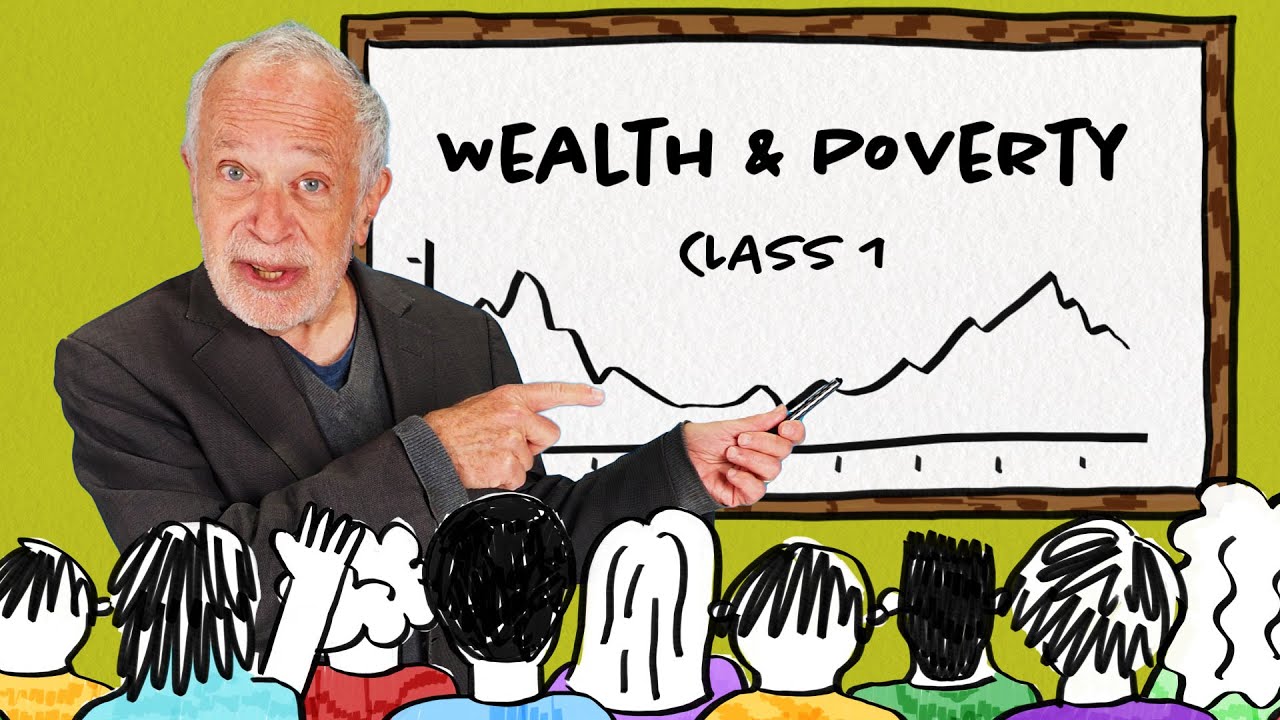
Class 1: “What’s Happened to Income & Wealth” by UC Berkeley Professor Reich
Jason 0 Comments Retire Wealthy
foreign [Music] [Applause] well I don't need that kind of hello but thank you for that hello it's so great to see all of you well let's uh let's get started I because I I want to talk to you about a lot of things this is today's outline every week I will begin with an outline of what we're going to talk about I'll also summarize the the things that I think are absolutely critical for you to have learned the previous week from lecture and from sections today's outline introduction and then we're going to talk about something that I call the paradox this course in terms of my philosophy of teaching is not about answering questions it's about raising questions and getting you to think much harder and more deeply than you have thoughts presumably about many of the issues that you may maybe take for granted so the first thing we're going to do is start with the Paradox we're going to talk about inequality by race it is impossible to talk about income and wealth inequality in the United States and many other places around the world without talking about structural racism they can be theoretically looked at separately but they are integrated and intertwined in so many fundamental ways and we will examine that literally every week and then economic Mobility and let me just say something about that before we get into it we are not only going to be examining the distribution of income and wealth but we're also going to examining a first cousin which is how easy it is for somebody who is born relatively poor or very poor or lower middle class or working class whatever you want to Define it to move up that's another very critical part of the story and the questions that we will be addressing and finally today we're going to be looking at a kind of a pretty basic question should you care about widening inequality of income and wealth is it something that we should be spending a lot of time on and but but exactly why if it is something you should care about so we'll get into all of this but first of all in terms of introductions uh there is a kind of social contract this is something I'm going to be talking about again and again in the course because some of you are political science majors and some of you are economics majors and some of your sociologists majors and some of you are history majors but this course is interdisciplinary in the sense that in my view my humble View after having been engaged with this subject academically and research-wise and also in terms of administering and running programs my view is that you can't separate economics politics sociology and history they're academically separate silos but for this course we are going to be integrating them entirely and the social contract is a very fundamental part of what we will talk about explicitly or implicitly and by social contract I mean what we owe each other as members of the same community in this classroom or Community as in Berkeley University of California or Community as in Berkeley town or Community as in East Bay or Community as in people who inhabit the United States or as human beings what do we owe each other we're very comfortable talking about rights we have a Bill of Rights in the Constitution what about a bill of responsibilities we all together are a learning community I don't believe that a chorus is a is a kind of place where a professor or a lecturer kind of depart gives you information that's just a waste of time you can get information from a book a text no the sections and this classroom are places where you are hopefully inspired to ask yourself hard questions one of the best ways of learning I have found in my life is to discuss something with somebody who disagrees with you now we have a little bit of a problem here at Berkeley and that the consensus is very strong it's hard to find a lot of people who disagree with the dominant view that I would assume many of you have but that means that in sections and to the extent that we in this course have a chance to actually discuss things we have to prize respect and protect people who have what might be considered to be dissenting views they are incredibly valuable to us and if you do have a quote minority or descending view not only should you be respected but also you obviously that discussion is the essence of learning for everybody so you are a gift to us uh introductions uh who I am who am I well I uh I've been teaching here at Berkeley for maybe 17 or 18 years I never expected it was going to be that long before that uh I was teaching at a university called Brandeis before that at a university uh called Harvard and along the way I also was in the Bill Clinton administration I was an economic advisor to Barack Obama before that I was Secretary of Labor in the Clinton Administration before that in terms of public work I was director of the policy planning staff of the Federal Trade Commission in the Carter Administration you've heard of The Carter Administration ancient history ah but before that I was assistant to the solicitor general in the Ford Administration am I getting into ancient history for you yeah and and before that I was I was special assistant to Abraham Lincoln as many of you you know that um there's a very very tough times but I've been so what I'm trying to tell you is that I'm bringing to this course uh some experience uh what else can I've written a lot of books my books are the kind of books that once you put them down you can't pick them up no that's that's a bad a bad joke uh that's all you need to know about me uh in terms of I you uh I've talked about what this course is about oh one more point about the course we are looking at the United States because that's where we get a lot of data no other country has as much data detail data about wealth income inequality and so on as the United States uh but if you are an international student or if you're interested in inequality or a widening inequality of income and wealth and other things in other countries hopefully what we begin to uncover here in this course about the United States will be useful to you because many of the trends that have occurred in the United States are beginning to occur elsewhere that is the United States seems to be the leader quote unquote in many of these dilemmas uh who you are here's where the clicker exercises come in so get ready hopefully uh so this is the first question this is the first clicker exercise starting with something very easy about you uh when somebody asks you where are you from you're most likely to say a California B somewhere else in the United States or see another Nation now what I do in the clicker exercise these polls I'll put something like this up and then I'll say to you go and what go means is consider it doesn't have to be a perfect answer nobody's going to know this is anonymous I mean nobody outside the CIA has any idea what you are just clicking that was a joke bad another bad joke nobody knows it's completely Anonymous and then I will say after a few seconds I'll say all right end the bidding now it's been 22 seconds let's end the bidding there and let's see what the results are so you can see 71 percent of you 376 are from California uh this is a public university I'm not surprised it's the best public university in the world it's true it is true and then but we've got a number of you from somewhere else in the United States and then about 70 of you that is 13 from another Nation uh so there is a little bit of diversity one out of eight people in the United States lives in California and let's go to question two more about you okay uh my major or major area of Interest falls into the following category a economics B politics political science or other social science or C Humanities or D Sciences or mathematics or E the Arts go and let's end the bidding there and see well it's a kind of a cross-section we've got uh we've got a 16 economics and then we've got a lot about a third of you politics or other social science 10 of you in the humanities almost 40 percent of you Sciences are math and the Arts only 13 of you are in the Arts well good for you okay more about you okay when I was growing up and this is actually more uh self-revelation that is relevant to the course certainly when I was growing up I would say my family was a wealthy purely subjective right B upper middle class or professional C middle class D working class e low income or poor again subjective go and let's end the bidding there and see sort of again understanding subjectively there's a big bunch of you say upper middle class or professional a small number say wealthy but then the rest of you are spread out middle class working class low income or poor I want to just stress the subjectivity here when I was growing up in a rural area of New York State I discovered when I was in my 20s not until I was in the 20s that we actually were quite poor but I didn't know it because everybody around me was poor that is you don't know much about where you are situated economically if everybody around you is pretty much the same it's only when you get a sense of Relativity that you learn more about your situation relativity keep that word in your head because we're going to be talking about relativity later on uh this is interesting this is the self-reported incoming undergraduates at UC Berkeley just the most recent data we could find and one thing that sort of struck me as interesting is that as you get lower income working class lower income more and more transfer students now that's not surprising when you think about it because a lot of people who are lower income or poor they start at community colleges and they do very well or they presumably do well because that's the way that's the only way they could transfer to a place like University of California Berkeley so what you see is a University of California system that is actually an extraordinary vehicle of upward Mobility for a lot of poor or lower income young people not ideal obviously a lot of things wrong with it but there is a vehicle that should be evident from this graph now we get to the paradox and maybe the best way of explaining this Paradox is to take a look at what has happened to economic growth in the United States in the post-war era now we're starting here uh before 1950 around 1946 a lot of what we do in this class starts around the end of the second world war because that is by just arbitrary definition the modern era where a lot of economic decisions and political decisions have been made about the structure of the economy 1946 is a key year it's a key year because I was born in 1946.
it's a key year because George Bush and Bill Clinton and Donald Trump were all born in 1946. all of us within about five months of each other we waved at each other as infants Dolly Parton 1946. you heard her at the beginning of the course she is a part of this course she lives inside me I want to meet her I want to meet her I mean she is my height we we believe in the same things I don't know why I have gone so long without meeting Dolly Parton if any of you know us Dolly Parton or somebody who knows Dolly Parton please get to work there's not a lot of time uh and you know who else would won 1946 share I mean anybody who's anybody was born in 1946 and so we start with uh 1946 and the question uh in fact I'm going to review it to you right now is what happened to the U.S economy beginning after the second world war and this is adjusted for inflation wow that's called economic growth and you see at the end I mean this is the recession pretty bad recession the pandemic recession but right now we're sort of right there and later on in the course we'll talk about what the FED is doing uh that may push us back down here but this record again adjusted for inflation by that I mean we're talking about real purchasing power this is an extraordinary record well great and then the question is well who has got all of that economic gain productivity and the typical workers wage compensation uh now here again let me pause to explain something very often in the course I'll put on the bare bones of a graph and some of you may be graphophobes you may see a graph and just freeze so what I want to do pedagogically is explain it before I show you what the graph is and why it's important now there's this graph that I'm about to show you will show you over time what has happened to the median wage medium that is half above half below the wage of the typical worker in the United States over time and I'm also going to compare that in this graph to productivity how productive the typical worker has been and what you will see is that productivity of the typical worker and wages of the typical worker Rose together in tandem which is not surprisingly that's what we thought was the rule in fact when I was in the Federal Trade Commission in the 1970s and we were starting with a bunch of economists we looked at the wage data and labor data and we saw that yes wages went up and productivity went up and they went up together but then I noticed something and I remember saying to the the other economists I was working with uh but there's something going on here they're starting to depart they're starting to separate productivity is continuing to go up and wages are starting to stagnate a little bit and the other economists that I shared that I was the director of policy planning but they were part of the policy planning staff they said no that can't be right I said well look at the data hello there's no that wouldn't happen well let me show you what has happened and again we're going to look at productivity growth and hourly compensation beginning in and and we're going to set it at cumulative change and this is since 1948.
So we're looking at how changes in the median wage starting in 1948 could have been 1946 continued to go up together and then I was starting to see something around here right 1979 1980 and this was what I was starting to see productivity was continuing to rise faster than the median wage what was that all about how did that happen why did that happen why that Gap that's a paradox it was a paradox in 1978 79 80 when I noticed it and began talking about it and other people began talking about it and it became more and more of an oddity we'll talk more about it but the question for you is well I want to show you this this is the this is current dollars uh this is why and if you don't adjust for inflation none of this makes most makes sense just look at the constant this is in 2018 in terms of real purchasing power uh in 1964 the real purchasing power of average hourly wages in the United States uh was 20.27 and and then you get you know to 2018 the latest data that we have confidence in and it's 22.65 cents so over this entire period of time uh you know a very long period of time when the United States economy is growing dramatically the typical worker average hourly wage is not any better off in terms of real purchasing power this has huge social and political implications so where did most of the economies gains go this is another clicker question but this is more complicated than the other clicker questions I've given you uh a uh into business investment most or be into government programs for the poor or C into to people who are already wealthy or D into Environmental Protection Public Health infrastructure education military expenditures basic research where did you think where do you think most of the economies gained since the median wage stayed flat and the economy kept growing well they must have those gains must have gone somewhere where did they go now let's end the bidding right there and let's see what you think uh a few of you eight percent think it when they went into business investment uh well some of it did certainly and uh in the government programs for the poor not well you don't think only if you don't think they did and then most 83 percent of you think it was people who were already rich what a cynical bunch of people you are and then uh into Environmental Protection and not very many well let's take let's take a look as we get into the chorus the reason these clicker poles become useful is they help you to think and ask yourself questions and then they also guide me in terms of helping give you not exactly the answers but data and the data is since 1980s here's what's happened and again we're using 1980 as the beginning we're we're looking at the relative to 1980 what happened to wages well we can see that wages of the bottom 90 percent the bottom 90 percent uh wages relative to what they were in 1980 well they Rose a little bit now I'm not talking about median median is half above half below I'm talking about the bottom 90 percent and then we say that the top one percent uh did much much better look at that their earnings their change in earnings relative to 1980 quite dramatic and then the top one tenth of one percent well that's a fairly powerful reality maybe you like it maybe you don't like it maybe it's inevitable maybe it's not a problem but at least we are seeing the same data income growth has changed a lot in the last 30 years I'm going to put on the slide I'm going to give you a graph that shows whose income grew the most if you're down at the bottom of the income ladder how much growth do you get if you're at the top of the income letter how much growth do you get but we're going to do something kind of complicated to this graph and this is going to I'm just warning you this graph is going to take you even you graphophiles even people like me who loves love the visual demonstration of of information uh you might choke a little bit on this graph are you ready I just want to prepare you okay did somebody say wow you said wow I like people say wow do you know why you said well why I mean why because it looks it's sort of shocking but for those of you who are not quite with us we're what we're doing is we're comparing 1980 and we see a 1980 most of the growth in income was in lower income people by 2014.
Look by 2014 look where the growth is and let's just be very specific the poor and middle class used to see the largest income growth but now and maybe Nikki we can move that poll over so people can read that but now at the very affluent the 99.999 percentile see the largest income growth in other words what we've seen is a dramatic shift in the structure of the economy more dramatic than a lot of people know again is it a problem is it not a problem well let's hold that off but let's at least see how dramatic the change has been uh and when I talk about the suspension bridge what I'm really talking about is a longer time series if you go back all the way back to the 1914 1915 we're not going to do this very often but I want to take the largest of you and what I want to show you is something that is quite amazing to me it's quite amazing because what we see when we take the Long View is that in the between 1912 and 19 30 beginning of the Great Depression we had the top one percent had a lot of the total income of this country and down here is the top half of one percent the top half of one percent had a lot of the total income in the 20s and early 1930s but then as the Great Depression wore on as we went into World War II as we went into well after I was born and Bill Clinton and Dolly Parton uh something happened and we had the greatest degree of equality we've had the top one percent had a the smallest percentage of total income this is before taxes and then around 1980 we started to go back to where we were and that's why I talk about it as a suspension bridge because we seem to be repeating some sort of historic cycle or reality and one of the paradoxes we've got to unravel in this course it's not economics it's not political science or politics is not exactly sociology is what happened in the middle why this period of time roughly from the end of the second World War through the 1980 or a little bit after 1980 why did we see the economy acting functioning so differently than it had before or since what was exceptional then now I should tell you another thing about the course here the first six weeks we're going to be examining why what happened we're going to look at the why from a lot of different angles and dimensions and then the last half of the chorus we're going to be looking not so much at the why we're going to be looking at well what do we do about it or if we're concerned about it what are the policy areas and the policy implications but we can't get to the policy part of the course until we answer the why part of the course because policy talk without understanding what actually happened is an exercise in futility some of you in fact next week we're going to be talking about Capital markets some of you may have a tendency to want to vilify certain people Elon Musk I don't know whoever whoever you want to vilify people who are very rich powerful I'm going to try to discourage that because making this about certain bad people misses the essence of what happened and also makes it impossible to have an intelligent policy discussion because this is not about anybody Behaving Badly or to put it slightly differently throughout this entire period of time there are people that behave badly you always have people that behave badly but what do we mean behave badly and everybody is working within a system the question is what changed about the system now this is important this is one we One screwed together this is between 1947 and 1979 but this shows you that the lowest fifth the poorest fifth of Americans they grew during this period in terms of income not height in terms of income grew more than even the top fifth this was a period time when we all all inhabitants of the United States grew together by income now I don't want to glorify this period of time I mean women were still second-class citizens black people Latinos were still second class or third-class citizens this was not a Gloria a glorified wonderful time but in terms of the narrow issue we are examining particularly with regard to income there is an extraordinary sort of growing together phenomenon now contrast this with the period right after this this is just before the Great Recession and I I I bracket this before the Great Recession because the Great Recession we will see changed a lot of the structure of the economy but look at what happened between 79 and 2010 in terms of the lowest fifth got poorer the top fifth started to move away from everybody else now we're not talking about the top one tenth of one percent we're talking about the top fifth the top 20 percent something what something happened in this period of time what happened huh we have not yet talked about wealth we've talked about income now I want to say something about wealth wealth is different from income in some very very important ways income is measured as a flow of earnings over a certain period of time usually a year this is my yearly income this is what I report if I'm reporting my income to the IRS this is my income for this year it's a flu wealth is the result of that flow wealth Is wealth concerns my assets where I put my income I may put my wealth into the stock market or I may put my savings and wealth and savings what we're talking about if I have any at all I might put it into a house or I might put my wealth into a someplace else to keep it a pension plan stock market wherever you put your wealth if you have any savings your savings are basically what we're talking about wealth results from that flow total assets at a particular time but here's the thing income also flows from wealth what do I mean by that if you have a bunch of stocks you're you have a lot of a lot of you have a lot of value in the stock market you might get dividends from the companies you own or the little pieces you own of companies Dividends are the companies basically giving you a little little piece of your ownership stake back per year not all shares of stock have dividends attach them but a dividend would be an example of making some money off of your wealth or you might own an apartment building and you get rent from that apartment building the apartment building is your wealth and the income from your renters is income from that wealth the reason I'm talking about all of this is people get very confused and policy makers even get very confused about all of this I mentioned Jeff Bezos for example Elon Musk what how do they live what do they live on they don't live on their wealth their wealth is in the stock market in shares of stock of Telsa Tesla or shares of stock of Amazon or whatever shares of stock they have no what they do is they borrow money from the bank usually a big bank and use their shares of stock they're huge tens hundreds of billions of dollars as collateral to get pretty good terms on a bank loan and they live off of those loans I'm looking at your faces and I would say 20 of you have no idea what I just said but we'll come back to that don't worry about it um income from wealth uh this is also important the top one percent here is the top one percent uh more and more of the top one percent this is a Time series again starting in the late 70s 1980 going all the way up as close as we can get to the present time in terms of good data you can see that the top one percent is getting more and more and more of their income from their wealth again my scanning of your faces if you understand what I'm talking about great if you don't don't worry about it we will come back to this this will become very very clear to you the readings make these these things very clear uh total family wealth this should be very clear to you but here's the top 10 percent in terms of wealth it starts in 1989 going through 2020 this is the top 10 percent in terms of total wealth this is the fit this goes up to the almost the 90th percentile this is the bottom 90 percent of Americans in terms of the total wealth that they have accumulated that's the thing about wealth it's very hard to accumulate it if you're not earning very much you may never accumulate well most people and we're again we're talking about in the United States accumulate almost no wealth the wealth they have is probably in their homes in the value of their houses if they don't have a house if they're renting then maybe their wealth is in the value of their car and if they don't have a car then maybe their wealth is in a savings account but most people relative to the top 10 percent relative to the top one percent have almost no wealth this again is important for you to understand in terms of the structure of the economy and how the structure of the economy has changed and it's important for you to understand in terms of what has happened to politics everything we are talking about has a correlate in the sociology and the politics of this country and I might add those of you who are international students if you were in France if you are in Britain if you are from Scandinavia you see a similar pattern emerging emerging not quite this extreme the wealth held by the richest 400 Americans the richest 400 Americans as a percentage of the total U.S economy let's take a look starting in 1980 this is just 400 do you get the picture this is not blaming them let me hasten to say this is not about them being bad or wrong or doing something that is nefarious this is simply about what has happened the 18 richest American families wealth as a share of total U.S wealth let's look at just the 18.
Just the 18. now let's pause and look at what all of this has meant in terms of racial categories now you know you've taken courses you understand you are sophisticated enough to know that race is a social construct but it's a social construct that has consequences social consequences in terms of racism and not just racism today but a history that becomes more and more important to explaining where people are today which of the following is true now sometimes I'm going to give you these kinds of questions and they are intended and you've got to understand they are intended to just be a little bit of a brain teaser I mean I just want you to suffer a little bit not not suffer I just want you to go just a little bit of a of a not very hard but just a little bit of a difficulty so this one and I do this which of the following is true only one of the following is true now which is it I will I will go through each of them uh a the real the racial wage Gap wages between black people and white people between black people and Latino people the racial wage Gap is larger than the racial wealth Gap that's a B the typical white families Financial assets are three times that of the typical block or latinx or Latino family or c relative to 1979 the income of the typical black female has increased while the income of the typical white male has declined one of these is true which is it go okay let's end the bidding there and then let's instead of my telling it to you let's just look at the data most of you say B is the one that's false the typical white family is financial three times not a typical black family uh and uh relatively few of you say a H and then uh relatively few of you say c okay so most of you are bunched around the typical white families Financial assets are three times Latin typical black girl latinx family uh well let's just see uh these are changes in wages by race starting in 1979 again 7980 is the critical beginning of something something happened and let's just take a look at this well what's interesting here is this is relative to 1979 relative to 79 interestingly we see that black women have done relative to where they were in 1979 they've done pretty well and white men relativity were they in 1979 really have are are worse off well that's important for a lot of reasons we will come back to the racial wealth Gap is substantially greater than the racial income gap let's take a look because wealth again is a cumulative effect and you can see that the racial wealth Gap here are white people in terms of the wealth that they have since 1963 adjusted for inflation incredibly increased Grill very substantial increase in wealth but here we have Black and Hispanic or Latino families not really keeping up at all so there's a big difference here the racial wealth Gap is much greater than the racial income gap and the mean value of financial Assets in the United States by race is it three times white people it's much more than three times so that's the data we have the answer was it had to do with paradoxically black women doing much better since 70 relative to 79 then white men relative to 1979.
now all of this is intended just to get your mind making you curious how is it what's happened what a lot of very dramatic things have happened over the last few decades well what were they now we've got to be careful with measurements and uh in your readings I just want to put a little bit of a of a warning sign average and median are different those of you who have taken courses it anything to do with mathematics or anything to do with measurements you wonder you understand this because median is uh halfway between the people at the top and the people at the bottom and the average can be brought up just because you have a lot of wealth or a lot of something at the top the basketball player Shaquille O'Neal and I have an average height of six foot two what does that tell you it tells you almost nothing also beware individual household or family some of these measurements and most of the measurements most of the data we have ultimately come from both the labor department and the Commerce Department of the United States some State data as well uh they St some of them are families some of them are individual some of them are household income or wealth just beware it could be that it's confusing if you're comparing apples and oranges uh the other thing to be aware of is whether we're talking about before taxes and transfers or after taxes and transfers and we'll come back to this these are just warning flags now in everything you've seen so far I have controlled for all of these but when you read all of your readings or all of the additional readings and by the way each week uh we've come up with readings that we gsis and I think are really quite essential but then there are additional readings for those of you who want to get into the details and I hope you have the time and inclination to do some of the additional readings but my point is some of this you just have to be ask yourself well are there talking about before or after toxin transfers also Beware of the measures of inflation because I've said now in this class several times when we look at time series I've said adjusted for inflation well yes you have to adjust for inflation if you want to actually talk about the real purchasing power of the dollar of a wage or whatever it is but there are different measures of inflation they're not all exactly the same it depends on what the market baskets of goods is that you are measuring and comparing also Beware of the difference between income inequality spending inequality and wealth inequality some of the readings I mean in fact there's a whole bunch of people out there who say we should not worry about income inequality as long as there is rough spending equality maybe they're right also samples racial statistics I mean a lot of the US government data on Race For example bunches all Asians together can you imagine anything more absurd you're taking a big chunk of the entire world it happens to be in the United States and you're saying they're all the same and we're going to treat them all the same well a lot of these categories are left over from years before when it didn't seem quite as absurd to categorize but we've got to be aware of how foolish some of these categories might be or become okay uh Mobility as I said to you earlier another dimension of all of this besides income inequality and wealth inequality we've got to look at how easy it is for somebody to move up or fall down I mean if there's a lot of Mobility if you uh born into a poor family can very easily become wealthy through just working and playing by the rules then it's less of a problem than if you're born poor and you can never get anywhere so let's take a look at Mobility uh this is a question for you it's a yes no question we can do it quite quickly are you satisfied with opportunities to get ahead in America by working hard a yes B no go okay let's end the bidding there and see what you think overwhelmingly 73 of you say no 27 of you say yes this is if there's any social compact in the United States this is sort of the essence of the social compact everybody ought to be able to get ahead by working hard by playing by the rules but if you can't something's wrong something's profoundly wrong I don't know what is in your heads when you say no but let's take a look at the way this question has been answered over the last 20 years by a random sample of Americans uh well most of them disagree with you most of them say uh they're satisfied with the opportunity to get ahead by working hard but interestingly if you look at the trend line just over the last 20 years the trend line is downward and anybody who has followed polls particularly opinion polls and they're flawed in all sorts of ways but one thing that's interesting and Gallup does this quite well is that even a fall of ten percent is significant it signals something this too we will come back to social Mobility by the percentage of children now here I've got to explain again before I put this up and confuse you we're going to look for each quintile each 20 of income group how easy it is for the children in that income group to get into a higher income group so let's just take a look and if you really want to look hard what we're looking at here is a child born in the bottom 20 by income 43 of those children are stuck in the bottom they never get out of the bottom 20 percent by contrast here 40 percent of the children born in the top 20 in the top quintile are stuck at the top they never get out of the top they stay in the top now this is a picture this is these are the last most recent data we have that I have confidence in I I think things have changed a little bit I'm not sure which direction but the point is that relative to most other so-called Rich Nations we now have less Mobility down or up depending on who you are born to in terms of your income class that says a lot about what you're going to be in for the next 20 30 50 80 years so the best way to do well in America is to be born rich hate to say it like that but it's sadly true or maybe it's positively true I I just put an evaluation in uh I don't know whether it's sad to me there are problems associated with lack of Mobility the percent of U.S children earning more than their parents at age 30.
Now this is really important in terms of the morale and the sense of fairness and optimism remember I was born in 1946 along with Bill Clinton and and George W and and Donald Trump and Dolly Parton and and Cher and and that was a time when everybody assumed that they would do better and their children would do better than they did and they were right to make that assumption because most children and then grandchildren did better than their parents you see how that can have an effect on group psychology the national understanding of the collective social compact and if that stops let's take a look let's take a look now we're talking about children born here we're going up to 1984.
Children born in 1984 who by the age of 30 are now you know getting up there they have their own children they have their own careers they have their own uh well that's a pretty good way of viewing it well let's see only half of children born in the early 80s we're making more than their parents my age 30. in 1940 1945 92 percent of children were by the age of 30 earning more than their parents we need to understand why we also need to understand the implications of all of this now finally the last thing I'm going to talk about today is should we care and the reason I even bring this up is because there are a lot of voices out there that say we should not and I want to talk to you about their arguments because it's very important in this class in your sections very important that we understand all of the arguments and that we respect those arguments but we have to at least understand what the arguments are uh should we care no one of the no reasons why we should not care about widening inequality of income and wealth and also lack of Mobility is that the rewards of great wealth fuel entrepreneurship from which we all benefit or to say that in a slightly less highfalutin way without inequality or at least some inequality of income and wealth there would not be enough incentive for people to invent and create businesses and create jobs you need those incentives that's what the argument would be and when you do have incentives when people are inventive when Jeff Bezos and Elon Musk and a lot of others are creating and inventing we all benefit secondly it's not a zero sum game it's not as if a dollar that goes to the very super wealthy is a dollar less than you that you or somebody who is poor has a possibility of of having or earning no it's not it's not a zero sum their wealth doesn't depend on somebody else's poverty we can all rise together we could we did in the early you know between 1946 and 1980 you saw the graph and so those people who say we shouldn't worry about it we'll say well wait a minute I mean there are things we should be doing maybe about poverty but we don't have to bring the wealthy down we don't have to tax the wealthy we don't have to we don't have to worry about inequality we can remedy poverty without reducing inequality or wealth and we just focus on poverty since I came to the Bay Area I've seen more and more and more poverty it's evident to all of us it's around us there are more people living on the street they're more homeless people well this argument would be if you want to do something about that we can do it let's focus on getting that done it doesn't mean we've got to reduce inequality because it's not a zero-sum game and finally the arguments of those who say don't worry about this are targeting the rich is socially divisive I was on television not too long ago debating with a fellow who I served with in the Clinton Administration named Larry Summers and uh we were talking about this issue and Larry kept on saying why do you continue Bob why are you continuing to attack the rich that's socially divisive why are you doing that we don't need to do that I said I'm not attacking in any individual person and not even attacking the rich and Larry said it certainly sounds like you are so I want to play a little bit of a game so occasionally in this class will do something that is a game and the purpose of the game is to elucidate to help you understand your own values and our Collective social contract and this is a I'm going to play a genie a kind of a an abstract Genie obviously and when I snap my fingers here's the deal I'm going to offer you and you've got to say whether yes you'll accept the deal or no you don't want the deal and the deal is the top one percent when I snap my fingers becomes twenty percent richer but wait before you reject my deal people in the middle become three percent richer and people that are near the bottom remain the same as before in other words I'm going to snap my fingers and nobody is worse off than they were before some people are better off some people are much better off but I'm a Genie and my snapping my fingers is the equivalent of certain public policies which we will talk about in the second half of the course and I want to know from you basically whether you'll agree or disagree so a is accept the deal and B is rejected ready I'm about to snap go okay let's end the bidding there see whether you want me to snap my fingers let's see go well 73 of you say you're going to reject the deal 27 of you are willing to accept the deal but those who are most of you are rejecting my deal remember nobody is worse off everybody is at least somebody is better off in economics this is called a Pareto Improvement a lot of economists and people who are persuaded by economists say this is unambiguously good well I'm disappointed in you at least those of you who who voted against this why you want the baby on the bottom to get something you don't want things to stay the same you want people on the bottom to get something but but what but wait a minute nobody's the people at the bottom aren't worse off the people in the middle are better off and the people in the top are better off so why are you is it Envy what's going on wait a minute it's not envy but you want your piece of the pie so you're willing to sacrifice the middle and everybody at the top all right give you a better deal give you a better deal okay I'm going to give you a better deal this is my revised deal and I'm sorry what's your name spring oh well of course Spring you're the one I've just I'm so it's great to meet you in person spring I got a better deal for you and anybody else who didn't like my first deal you'll love this one and you'll like this one too uh because here's my deal top one percent becomes 20 richer that was what we had before uh the people in the middle become 10 richer um pretty much better than the three percent and people that are near the bottom two percent richer for spring you got it they're better off better off better off although okay uh and uh so all those people who accept A and B reject go okay let's end the bidding there and let's just take a look well more of you came along but you're still a majority of you 58 still reject my deal so you're willing to you're willing to give up an increase in the gains at the bottom for what why who else besides spring yes what wait a minute wait wait there's no such thing as created wealth oh oh well I'm but there is in the sense that you've got inventors you've got a an economy that is growing I told I showed you how much the economy is growing I mean you've got you've got away all sorts of ways of of of more wealth and more income being generated over time as the economy come becomes more productive I mean all kinds of wealth my genie is just a a sort of a a a a stand-in for what has happened so what's the problem what's your name Emily Lily Emily Lilly Lilly Emily Lily Lily well what's your problem why don't you you're willing to sacrifice the gains for people at the bottom okay let me just repeat what I think uh you're saying so everybody else can hear it you're saying that the wealth these data on wealth or income increases or even my genie it's not we're just taking from Peter to pay Paul we're taking from the environment a lot of this has to do with uh the climate getting worse and you don't like the fact that any increase in wealth at the top or anywhere is actually going to be at the expense of the quality of life for other people on the planet that's what you're saying isn't it so it's not about so much inequality here it's about the trade-offs globally and also in terms of climate right that's that's what sort of what I understand well I understand and I respect that and maybe you Lily and you spring and others here would find what I'm now going to suggest another quote-unquote game particularly Illuminating along those lines it's an experiment and let me tell you how it's going to work you all are going to be divided into couples now I don't mean you are going to be a couple I don't mean you are going to have to live with a person but next to you but every one of you just look to the person to your right or to your left okay and if you don't have somebody to your right or left if you don't have somebody to your right or left then then you you better find somebody because you're going to be pretty lonely in this no you're not okay here's the experiment uh I want I want you to divide up into couples of and I on my left the person on my left is going to get figuratively a thousand dollars from me figuratively in fact let me give you the rules this is very and and the rule what you know one rule here is complete silence this this game is only would work if everybody's doing it in silence this is a learning game uh so and rule is you form couples and the person on my left is person a and the person on my right is person B so are you two so you're a and your B uh you need neither knows the other now if if you guys are best friends it's not going to work or but you've got to get into a mindset in which you don't really know each other and this is a one time only exchange that we're going to be talking about ordeal I offer a thousand dollars to a and a offers a portion to B and writes it down in complete silence and then B accepts by writing yes or rejects by writing no and my thousand dollars offer offer goes through only if B accepts so what I'd like you to do in complete silence is to do this now and when you're done just put up your hands and then I want to examine it your deal when you're done put up your hands if you're are okay uh okay now what I would like to do next is and this is question number nine if you were a person a I want to know how much you offered person B uh now a is more than five hundred dollars B is between 10 and 500 dollars C is between one dollar and nine dollars and D is zero so again this is only to be answered by A's and let's take a look and see okay uh the majority vast majority of you were between 10 and 500 but we do have a few of you offered more than 500 and we've got 15 of you who offered between one and nine dollars and we've got 11 of you who offered zero now I would like to talk to somebody who offered between one dollar and nine dollars okay you offered was you offered be what's your name Henry Henry how much did you offer be a dollar did you accept the dollar you did not Henry do you realize you just forfeited 900 I mean you forfeited a lot of money did you expect that your name Graham did you expect that Graham would agree you hoped he would but that's not my question did you expect Graham to agree to one dollar no then why did you offer him um you you want to make a point well you made a point I'm not sure it's the point you wanted to make but what point did you want to make oh I see you're reminded to make a point that Graham was would be better off but Graham you rejected a dollar now that means you could have had a dollar Graham and why did you reject the dollar you would have accepted ten dollars but why did you reject one dollar you can't do anything with a dollar yes you can you could you know you could buy yourself one fifth of a cup of coffee or I mean what you mean in other words ten dollars would have done it for you Graham Graham wait a minute I want to just make sure I understand you would have accepted ten dollars spring hold it so so I well so you've how do you feel about that fine all right anybody else anybody else out there who offered sort of one dollar ten dollars nobody else nobody well I know you did because I I have the evidence up here uh what I'd like the reason I'm I'm asking is because I want to get at what it was that made you think that b would accept one dollar or five dollars I mean it must have been something like B is better off than b was before like we saw right here all right let me ask a different question is there anybody who offered more than 500 okay right here what's your name Jay you offered more than 500 why did you offer more than 500.
because you're guaranteed an acceptance and you thought that offering less than 500 might jeopardize the whole thing and your B yeah and you and and your name I'm sorry yeah and you and you accepted would you have accepted something less than 500 how much less than 500 . you I'm sorry you would accept anything I mean let me just stop for a second and just explain what we're doing here we are engaged in a little bit of an experiment about fairness we all carry around in our heads some notion of what is quote unquote Fair and some of us have very strong ideas about fairness and some of us have kind of mushy ideas about fairness but in terms of the game we just did we are putting ourselves in the position of somebody next to us in terms of trying to guess what they think is fair if you were an a person but a b person you are responding to your own sense of fairness or unfairness and if you have a very very strong sense of what's fair and unfair you might say no even to a very strong offer if the offer is less than say five hundred dollars you might and we could go on and on and I wish there were there was time and I wish I could go interview you and we could all interview each other but you understand that's essentially what we are doing the purely Pareto Improvement optimal assumption efficiency economics assumes that any gain by B would be enough to make that trade a good trade just like the genie nobody loses anything everybody games but what intrudes on the genie game is the same thing that intruded for some of you on the little thousand dollar game we just did and that is your own sense of something about it maybe being unfair and what we need to do is unpack what that is we don't have time to do that maybe hopefully in your sections you can do it but it's important because as we diagnose what has happened to the economy what has happened to inequality why we're concerned about inequality if we are as we investigate our Notions of fairness or lack of fairness become profoundly important and we've got to understand where they come from let me just end on this little anecdote in 20 well when I was Secretary of Labor I would all the time go out to Ohio and Pennsylvania and North Carolina and other places where there are a lot of unionized workers and a lot of manufacturing workers and a lot of non-unionized workers I didn't consider myself Secretary of just unionized America I was Secretary of Labor and I would go out and I would talk with thousands and thousands and thousands of workers hourly wage workers and that was in 1990 starting in 1993 four five six seven uh and what I found as I went out to talk with these workers is a little bit of feeling of being treated unfairly now it wasn't dramatic it wasn't that they were absolutely angry but I kind of conducted a free-floating focus group if you want to put it that way I would talk to the you know how are you doing how's your family doing how's your job and we'd get into their feelings about the system not treating them quite fairly you know the bosses are doing great the executives are doing great uh the stock market blah blah blah blah and I'd pick up something everywhere I went unionized or non-unionized and then in 2016 years later I went back to these same States sometimes the same people often their children once in two or three instances their grandchildren and we would talk about just how they're getting on we'd have these discussions a free-floating focus group but I'd ask them the same kind of questions and what I picked up was much more anger now what I picked up is exactly what you saw in a lot of today's charts they didn't put it in terms of these charts they put it in terms of how they felt subjectively about the way the economy was run the way the system was run the way politics was being undertaken the way the powerful people treated them they were not Democrats or Republicans they didn't put Democrats or Republicans the first thing they didn't they didn't begin with their political philosophy they just began with their their feelings about how they were being treated and they were angrier substantially angrier in 2016 than they were 20 years before and then I would ask them in 2016.
well who are you interested in in terms of presidency I mean we were just on the verge of the 2016 election uh we were still months away in fact we were still before the nomination but we were on the verge of the 2016 election and I'd say well who's who's interesting to you and over and over and over again in Ohio and Michigan and Minnesota and North Carolina and I mean I would hear in Pennsylvania the same two names Bernie Sanders and Donald Trump often from the same people now I want to suggest to you that the subject of this class is directly and powerfully related to the subject of democracy and the quality and capacity of our country to survive whether you are worried about climate change or you're worried about anything else I want to suggest to you that much of what we are going to be talking about over the next 14 weeks is happening now this is not an exercise in theory this is an exercise in understanding reality understanding a system a political economic system moving through time it's going to be a wild ride thank you for joining me [Applause]
Read MoreGrowing Wealth Inequality In The World And America
Jason 0 Comments Retire Wealthy
Growing Wide Range Inequality worldwide and also
America Let’s beginning with some terrifying stats. Right here, wealth describes a cumulative total amount
of a family’s financial as well as genuine assets however doesn’t include financial debt. Statistics from the 2018 Global Wide Range Record
by Debt Suisse show that 1% of the globe’s richest very own 45% of the World’s wealth. Individuals in the 1% have estimated assets
of greater than $1 million. Grownups whose wealth is cumulative to less
than $10,000 hold just 2% of the globe’s wealth.These individuals

comprise 64% of the earth’s. populace.
Yes, an entire 64%. Individuals worth $30 million as well as above are.
described as the ultra-high internet well worth people, that makes feeling since $30 million is a.
great deal of cash. These people, incorporated, have a portion of.
the globe’s wealth, at 11.3%. In regards to population, however, they are.
sorely lacking in numbers, at only 0.003%. Jeff Bezos, Costs Gates, Warren Buffet, Amancio.
Ortega, Mark Zuckerberg, Bernard Arnault, Carlos Slim, Larry Ellison, and Larry Page.
are the nine richest guys on the planet. Their combined wide range, according to Forbes.
in January 2018 was 687.6 billion. This figure is equal to the overall wide range.
of; get this, 4 billion of the poorest people in the globe. This is to suggest, in regards to riches, if you.
place these 9 gents on one side of the scale (or see-saw if you prefer), you would certainly need.
an excellent 4 billion of the globe’s poorest beyond in order to stabilize it out.These figures represent the shocking wealth. inequality in between the abundant as well as the poor on the planet at huge, yet what is even more stressing.
is that these numbers keep expanding each year. Your House of Commons in the UK estimated that.
by 2030, 1% of the richest people in the world will certainly have two-thirds of the globe’s.
wide range. Is there a way to rein this in? These figures are in fact concerning, as well as.
eventually, they would certainly cause a poorer world. What are the factors for this inequality? What are the steps that can be taken to fix.
this problem? Closer Home.
America makes quite a substantial portion of the globes’ richest, as well as it is, therefore,.
not a surprise that the riches inequality here would be equally as disconcerting. In 1982, the richest man on the Forbes 400.
Wealthiest in America was worth a modest $2 billion. In 2018, to make it to the Forbes 400, you.
had to be worth at the very least $2.1 billion. The wealthiest male in America, who is the richest.
Now, allow us relocate to homes. In the very first quarter of 2017, the complete net.
worth of US houses together with charitable organizations was $94.7 trillion. The presumption would be that when separated.
among the complete number of houses, each would certainly get an equivalent share which equates.
to about $760,000. However, 50% of the total number of families.
throughout this quarter was worth just $11,000. 1% of this country’s richest.
hold 40% of the total riches. On the various other hand, 7% of the country’s wide range.
is held by almost 80% of the population. You can plainly recognize the fad in these.
figures. The rich are incredibly abundant as well as the bad extremely.
As well: and it is a vicious circle that maintains spinning.This widening gap might not have been as disturbing. if we had more people on the rich side. Instead, you will certainly determine that many individuals. hold much less than 10% of the globe ' s wealth.
The major factor behind riches inequality is income inequality. Earnings inequality comes as a result of the. This cost is typically determined with
a. comparison of the demand for the skill ability and and also number of people who are willing to.
for the work, its market price would certainly go down because one means or the other, the task placement.
is going to be filled. We live each time when most jobs have a low. market value, but some exclusive
ones have really couple of certified persons. The market cost difference of. both is the very first means with which riches inequality starts. Education is another primary factor for the expanding. wide range inequality in the world today, America most especially.The degree of education one obtains is normally. symmetrical to the ability
she or he is most likely to obtain. As stated over, the much more marketable the. skill, the greater the marketplace cost for it.
At the exact same time, even though education might. be totally free for all, the quality of education is
in some cases influenced by the environment and also. area the school lies in.
Schools discovered in areas with a better. socio-economic course tend to generate pupils with a much better chance of obtaining an extremely valuable. skill.Such colleges are additionally more than likely to promote.
intelligence, personal drive, and also self-control, all features required to make riches.
The resultant revenue inequality leads to a. significant gap in riches. The reverse holds true for poorer communities. As has actually been seen in recent times, the development. of modern technology has actually considerably motivated a boost in the wide range void in between the rich and the. bad. A great deal of people have actually been forced to.
leave the work market as their job is taken over by machines and other types of technology.
A phone driver benefiting a Telco business.
40 years, domestic workers will lose their job to artificial intelligence.Similarly, the growth in modern technology has actually produced. The wealthiest man in the world, Jeff Bezos made. Following him carefully is Costs Gates, yet one more.
These rich characters are increasingly. rich, as they use a solution most can not
find anywhere else. The richer they get, and as hands-on workers. lose their jobs to innovation, the broader the space in between the very abundant and also the very. poor obtains. One more variable that boosts this gap in between.
the rich and also bad is the tax obligation systems in place.The tax obligation code in the majority of nations worldwide.
In the UK, over 10 million words are used. Do you believe these words are to assist the bad. It’s certainly debatable.
The wide range gap between the inadequate and the abundant. is substantial. It is triggered by fairly a number
of elements,. some beyond our control, some not so much. The very best means to manage this inequality.
This means ensuring an equivalent as well as quality requirement.
As well as I will certainly see you all, in the next one. 5 Routines Keeping You Poor. Every month you seem to always have just enough … or have you ever been in an awkward scenario in which your credit scores card obtained declined.
Class 1: “What’s Happened to Income & Wealth” by UC Berkeley Professor Reich
Jason 0 Comments Retire Wealthy
you heard her at the start of the program she belongs of this program she lives inside me I intend to meet her I wish to meet her I mean she is my height we we believe in the very same things I don'' t know why I have actually gone as long without meeting Dolly Parton if any of you understand us Dolly Parton or someone who knows Dolly Parton please reach work there'' s not a great deal of time uh and you recognize who else would won 1946 share I imply anybody that ' s anybody was birthed in 1946 as well as so we start with uh 1946 as well as the concern uh as a matter of fact I ' m going to assess it to you today is what occurred to the U.S economic climate beginning after the second globe war and also this is readjusted for rising cost of living wow that'' s called economic growth and you see at the end I indicate this is the recession rather bad recession the pandemic economic downturn however now we'' re type of right there and in the future in'the course we ' ll talk concerning what the FED is doing uh that might push us back down below yet this record again changed for rising cost of living by that I indicate we'' re speaking about real acquiring power this is a remarkable document well excellent as well as then the inquiry is well who has got all of that economic gain productivity and also the regular workers wage compensation uh currently right here once again allow me stop briefly to clarify something extremely frequently in the course I'' ll placed on the bare bones of a graph and also several of you might be graphophobes you might see a chart and just freeze so what I intend to do pedagogically is discuss it before I reveal you what the chart is and why it'' s vital now there ' s this chart that I ' m regarding to reveal you will reveal you gradually what has occurred to the typical wage tool that is half above half listed below the wage of the normal employee in the USA with time as well as I'' m likewise mosting likely to compare that in this graph to efficiency exactly how effective the typical worker has been and what you will see is that performance of the regular employee as well as salaries of the regular employee Rose together in tandem which is not remarkably that'' s what we thought was the policy in truth when I remained in the Federal Profession Commission in the 1970s and we were starting with a number of financial experts we looked at the wage data as well as labor information as well as we saw that indeed incomes went up and performance went up and they rose with each other yet then I observed something and I bear in mind saying to the the other economic experts I was collaborating with uh yet there'' s something going on below they ' re starting to leave they'' re starting to different productivity is continuing to rise and also wages are beginning to go stale a little bit as well as the other economists that I shared that I was the supervisor of policy planning however they were part of the policy preparation staff they claimed no that can'' t be right I claimed well look at the data hello there ' s no that wouldn ' t take place well let me show you what has occurred and once more we ' re going to look at efficiency development as well as hourly payment start in and also as well as we'' re going to set it at cumulative change and this is since 1948.
We'' re looking at exactly how adjustments in the mean wage beginning in 1948 could have been 1946 continued to go up together and also then I was starting to see something around below ideal 1979 1980 and this was what I was beginning to see productivity was continuing to rise faster than the mean wage what was that all regarding how did that occur why did that take place why that Gap that'' s a mystery it was a mystery in 1978 79 80 when I observed it as well as began speaking about it and also other individuals began talking concerning it as well as it ended up being more and also much more of a curiosity we'' ll talk a lot more regarding it but the concern for you is well I desire to reveal you this this is the this is existing bucks uh this is why and also if you don'' t adjust for inflation none of this makes most makes feeling just look at the consistent this is in 2018 in terms of genuine buying power uh in 1964 the actual investing in power of average hourly earnings in the United States uh was 20.27 and and after that you get you understand to 2018 the newest data that we have confidence in and it'' s 22.65 cents so over this entire period of time uh you know an extremely lengthy period of time when the United States economic situation is growing significantly the normal employee ordinary per hour wage is not any far better off in terms of real buying power this has significant social as well as political ramifications so where did many of the economic climates gains go this is an additional remote control inquiry yet this is much more challenging than the various other clicker inquiries I'' ve given you uh a uh right into service investment most or be into federal government programs for the inadequate or C into to individuals that are currently affluent or D into Environmental Defense Public Wellness framework education and learning army expenditures basic study where did you believe where do you assume most of the economies gained since the typical wage stayed level as well as the economy kept growing well they have to have those gains should have gone someplace where did they go currently let'' s finish the bidding right there'as well as allow ' s see what you believe uh a few of you 8 percent think it when they went right into organization financial investment uh well some of it did absolutely and uh in the government programs for the poor not well you wear'' t believe just if you don'' t assume they did and also after that most 83 percent of you assume it was people that were currently rich what a cynical lot of individuals you are and also after that uh into Environmental Protection and also not really numerous well allow'' s take let ' s take a look as we get into the chorus the reason these remote control poles become useful is they assist you to assume and ask on your own inquiries and also after that they also assist me in terms of assisting offer you not specifically the solutions but information and also the information is because 1980s below'' s what ' s took place and again we ' re using 1980 as the start we'' re we ' re looking at the loved one to 1980 what took place to wages well we can see that salaries of the lower 90 percent the bottom 90 percent uh incomes relative to what they were in 1980 well they Rose a little bit currently I ' m not talking regarding average median is half above half below I'' m chatting concerning the bottom 90 percent and also after that we claim that the leading one percent uh did much a lot better look at that their revenues their modification in earnings relative to 1980 rather significant and then the top one tenth of one percent well that'' s a relatively effective truth maybe you like it perhaps you put on'' t like it'maybe it'' s unpreventable possibly it ' s not an issue yet at the very least we are seeing the very same data revenue development has transformed a lot in the last'30 years I ' m going to place on the slide I'' m going to give you a chart that shows whose earnings expanded the most if you'' re down at the bottom of the revenue ladder just how much development do you obtain if you'' re at the top of the earnings letter how much growth do you obtain however we'' re going to do something kind of complicated to this chart and also this is going to I'' m simply warning you this chart is going to take you even you graphophiles also individuals like me who likes love the visual demo of of info uh you may choke a little bit on this chart are you all set I just want to prepare you okay did somebody say wow you said wow I such as people state wow do you recognize why you said well why I imply why due to the fact that it looks it'' s sort of stunning but for those of you that are not quite with us we'' re what we'' re doing is we ' re contrasting 1980 and we see a 1980 many of the growth in income was in reduced income individuals by 2014. Look by 2014 look where the growth is as well as let'' s simply be very certain the poor as well as center class utilized to see the largest earnings growth however now as well as maybe Nikki we can move that survey over so individuals can check out that however now at the really affluent the 99.999 percentile see the largest income development in various other words what we'' ve seen is a dramatic change in the structure of the economy extra remarkable than a whole lot of individuals understand once more is it a problem is it not a trouble well allowed'' s hold that off yet allow'' s a minimum of see how dramatic the adjustment has actually been uh and when I discuss the suspension bridge what I'' m actually speaking around is a longer time collection if you go back completely back to the 1914 1915 we'' re not going to do this extremely typically however I wish to take the largest of you and what I intend to reveal you is something that is quite incredible to me it'' s fairly remarkable due to the fact that what we see when we take the Viewpoint is that in the between 1912 and 19 30 start of the Great Depression we had the top one percent had a great deal of the overall revenue of this country as well as down right here is the leading half of one percent the leading half of one percent had a great deal of the overall revenue in the 20s as well as very early 1930s but then as the Great Clinical depression used on as we entered into The second world war as we went right into well after I was born as well as Costs Clinton and also Dolly Parton uh something took place and we had the best level of equality we'' ve had the top one percent had a the tiniest portion of overall income this is prior to taxes as well as after that around 1980 we started to go back to where we were which'' s why I chat about it as a suspension bridge due to the fact that we appear to be duplicating some type of historic cycle or truth and among the paradoxes we'' ve reached unravel in this program it'' s not business economics it ' s not government or national politics is not exactly sociology is what took place between why this duration of time roughly from completion of the second Globe War via the 1980 or a little after 1980 why did we see the economic situation acting operating so differently than it had before or since what was phenomenal then now I ought to inform you another feature of the training course right here the very first six weeks we'' re going to be taking a look at why what happened we'' re going to consider the why from a whole lot of various angles and dimensions and afterwards the last fifty percent of the chorus we'' re mosting likely to be looking not so much at the why we'' re mosting likely to be considering well what do we'do concerning it or if we ' re concerned regarding it what are the policy locations and the plan ramifications however'we can ' t reach the policy component of the training course till we answer the why part of the course since plan talk without recognizing what really happened is a workout in futility a few of you actually next week we'' re mosting likely to be discussing Resources markets several of you may have a tendency to wish to vilify particular individuals Elon Musk I wear'' t know whoever whoever you desire to vilify individuals who are really rich effective I'' m going to attempt to discourage that since making this concerning certain poor people misses the essence of what took place and likewise makes it difficult to have a smart plan conversation since this is not regarding any person Behaving Badly or to place it a little differently throughout this whole period of time there are people that behave severely you constantly have people that act terribly yet what do we imply behave severely and also everybody is functioning within a system the question is what changed about the system currently this is necessary this is one we One screwed together this is between 1947 and 1979 yet this shows you that the most affordable fifth the poorest fifth of Americans they expanded during this duration in regards to earnings not elevation in regards to earnings expanded greater than even the top fifth this was a duration time when all of us all residents of the United States expanded with each other by earnings currently I put on'' t desire to proclaim this amount of time I mean ladies were still second-class citizens black people Latinos were still 2nd course or third-class citizens this was not a Gloria a pietistic terrific time but in terms of the slim concern we are examining especially when it come to income there is a remarkable kind of expanding together sensation currently contrast this with the duration right hereafter this is prior to the Great Economic crisis and I I I brace this prior to the Great Economic downturn due to the fact that the Great Economic downturn we will certainly see altered a great deal of the structure of the economy yet check out what occurred between 79 and 2010 in terms of the cheapest fifth got poorer the top 5th begun to relocate away from everybody else now we'' re not discussing the leading one tenth of one percent we'' re speaking about the leading 5th the leading 20 percent something what something took place in this amount of time what occurred huh we have actually not yet discussed riches we'' ve discussed revenue currently I desire to state something regarding riches wealth is various from earnings in some very extremely crucial ways revenue is determined as a circulation of incomes over a certain amount of time typically a year this is my yearly income this is what I report if I'' m reporting my earnings to the IRS this is my revenue for this year it'' s an influenza wealth is the result of that flow wealth Is riches concerns my properties where I put my earnings I might put my wealth right into the securities market or I may put my savings as well as wide range as well as cost savings what we'' re chatting regarding if I have any at all I could put it into a residence or I might place my riches right into a someplace else to maintain it a pension plan stock exchange anywhere you put your riches if you have any cost savings your savings are generally what we'' re discussing wide range results from that circulation total assets at a certain time yet below'' s the important things revenue likewise streams from wealth what do I indicate by that if you have a number of stocks you'' re you have a whole lot of a lot of you have a great deal of worth in the securities market you might obtain rewards from the business you possess or the little items you possess of firms Rewards are the firms basically giving you a little bit little piece of your possession risk back each year not all shares of stock have dividends connect them but a returns would be an instance of making some money off of your wide range or you may own an apartment structure and you get rent from that apartment or condo constructing the home structure is your wealth as well as the income from your tenants is earnings from that riches the factor I'' m discussing all of this is people obtain really confused and plan manufacturers even get extremely overwhelmed concerning every one of this I mentioned Jeff Bezos as an example Elon Musk what exactly how do they live what do they survive they don'' t survive their riches their wealth remains in the stock market in shares of stock of Telsa Tesla or shares of supply of Amazon.com or whatever shares of stock they have no what they do is they borrow money from the bank typically a huge financial institution and also use their shares of supply they'' re huge tens hundreds of billions of bucks as security to get pretty excellent terms on a financial institution lending as well as they live off of those loans I'' m considering your faces as well as I would certainly state 20 of you have no idea what I just claimed yet we'' ll come back to that don ' t fear about it um revenue from wealth uh this is likewise crucial the top one percent here is the top one percent uh an increasing number of of the top one percent this is a Time collection once more beginning in the late 70s 1980 copulating up as close as we can obtain to the here and now time in terms of great information you can see that the leading one percent is getting a growing number of and extra of their revenue from their wide range once more my scanning of your faces if you understand what I'' m speaking about wonderful if you wear'' t don ' t fret about it we will certainly return to this this will certainly become really really clear to you the readings make these these things very clear uh overall household riches this need to be very clear to you however here'' s the top 10 percent in regards to wealth it starts in 1989 going via 2020 this is the leading 10 percent in regards to total wide range this is the fit this rises to the virtually the 90th percentile this is the lower 90 percent of Americans in regards to the complete wealth that they have actually accumulated that'' s things concerning riches it ' s very hard to accumulate it if you'' re not gaining quite you may never ever collect well many people and we'' re once again we ' re speaking concerning in the United States collect nearly no riches the wide range they have is possibly in their homes in the worth of their houses if they put on'' t have a house if they ' re renting after that perhaps their wealth remains in the value of their vehicle and if they don'' t have a vehicle then maybe their riches is in an interest-bearing account but lots of people about the leading 10 percent loved one to the leading one percent have virtually no wealth this once more is crucial for you to understand in terms of the structure of the economic climate as well as exactly how the structure of the economic climate has actually altered and it'' s vital for you to comprehend in terms of what has actually happened to national politics everything we are speaking about has a correlate in the sociology and also the national politics of this nation and also I could add those of you who are global trainees if you were in France if you remain in Britain if you are from Scandinavia you see a comparable pattern emerging arising not quite this extreme the riches held by the richest 400 Americans the wealthiest 400 Americans as a percent of the overall U.S economic situation let'' s have a look starting in 1980 this is just 400 do you obtain the image this is not criticizing them let me accelerate to claim this is not concerning them being poor or incorrect or doing something that is nefarious this is just regarding what has actually taken place the 18 wealthiest American households riches as a share of total U.S riches allow'' s consider simply the 18.
Just the 18.now let'' s pause as well as look at what all of this has indicated in terms of racial groups now you recognize you'' ve taken courses you comprehend you are advanced adequate to know that race is a social construct however it'' s a social construct that has repercussions social repercussions in regards to racism as well as not simply bigotry today however a history that becomes an increasing number of essential to discussing where individuals are today which of the complying with holds true now often I'' m going to give you these sort of concerns and they are meant and you'' ve reached comprehend they are planned to simply be a bit of a brain teaser I suggest I simply desire you to experience a little bit not not experience I simply want you to go simply a little bit of a of a not extremely hard yet just a little of a difficulty so this one as well as I do this which of the complying with is real just one of the adhering to holds true now which is it I will I will go through each of them uh a the genuine the racial wage Void wages in between black people and white people between black people as well as Latino individuals the racial wage Void is bigger than the racial wide range Space that'' s a B the normal white family members Monetary assets are three times that of the typical block or latinx or Latino family or c loved one to 1979 the income of the typical black lady has actually raised while the revenue of the typical white male has decreased one of these holds true which is it go all right let'' s end the bidding process there and also'then let ' s as opposed to my informing it to you let'' s simply take a look at the information most of you say B is the one that'' s false the common white family is monetary 3 times not a regular black family uh and uh relatively few of you say a H and afterwards uh reasonably few of you state c fine so most of you are bunched around the common white families Financial possessions are three times Latin regular black woman latinx family members uh well let'' s simply see uh these are changes in earnings by race starting in 1979 again 7980 is the essential start of something something took place as well as let'' s simply take an appearance at'this well what ' s fascinating below is this is about 1979 about 79 surprisingly we see that black women have done about where they'remained in 1979 they ' ve done rather well as well as white males relativity were they in 1979 truly have are are even worse off well that'' s crucial for a lot of reasons we will certainly return to the racial wide range Void is significantly above the racial revenue space allow'' s have a look due to the fact that riches once more is a cumulative result as well as you can see that the racial riches Gap below are white individuals in terms of the riches that they have actually because 1963 adjusted for rising cost of living extremely raised Grill extremely considerable boost in riches but below we have Black and Hispanic or Latino households not really maintaining up at all so there'' s a large difference here the racial riches Gap is much better than the racial revenue gap as well as the mean value of financial Assets in the United States by race is it three times white people it'' s much extra than three times to ensure that'' s the data we have the answer was it involved paradoxically black women doing far better given that 70 about 79 after that white guys relative to 1979.

now every one of this is meant simply to get your mind making you curious just how is it what'' s occurred what a great deal of really significant things have actually occurred over the last few decades well what were they currently we'' ve reached take care with dimensions and also uh in your readings I simply wish to place a little bit of a of a caution indication average as well as average are different those of you that have taken courses it anything to do with mathematics or anything to do with dimensions you question you comprehend this because median is uh halfway between individuals on top and also individuals near the bottom and the average can be raised simply due to the fact that you have a great deal of riches or a lot of something at the leading the basketball gamer Shaquille O'' Neal as well as I have an ordinary elevation of six foot 2 what does that inform you it tells you practically absolutely nothing also beware specific household or family members several of these measurements as well as the majority of the measurements the majority of the information we have actually inevitably originated from both the labor department as well as the Commerce Department of the United States some State data too uh they St several of them are families several of them are specific several of them are household earnings or wide range simply beware it can be that it'' s perplexing if you'' re contrasting apples and also oranges uh the other thing to be familiar with is whether we'' re speaking about gross as well as transfers or after tax obligations and transfers and also we'' ll return to this these are just alerting flags currently in every little thing you'' ve seen up until now I have actually controlled for every one of these but when you read all of your readings or every one of the additional analyses and also incidentally weekly uh we'' ve create readings that we gsis as well as I believe are truly rather vital however then there are added analyses for those of you that intend to get right into the details and I wish you have the moment as well as inclination to do several of the additional readings however my point is some of this you simply need to be ask on your own well exist speaking about prior to or after toxin transfers likewise Be cautious of the actions of rising cost of living due to the fact that I'' ve claimed now in this class numerous times when we look at time collection I'' ve said adjusted for rising cost of living well of course you have to change for inflation if you wish to really speak about the actual buying power of the dollar of a wage or whatever it is however there are various procedures of inflation they'' re not all precisely the exact same it relies on what the market baskets of items is that you are measuring and comparing also Beware of the difference in between income inequality costs inequality and riches inequality some of the readings I suggest actually there'' s a whole bunch of individuals available who claim we must not stress over income inequality as long as there is harsh spending equal rights maybe they'' re right also samples racial stats I suggest a great deal of the US government data on Race As an example numbers all Asians with each other can you envision anything more ridiculous you'' re taking a big chunk of the entire globe it occurs to be in the USA as well as you'' re claiming they ' re all the exact same and also we ' re mosting likely to treat them all the same well a whole lot of these classifications are left over from years prior to'when it didn ' t appear rather as absurd to categorize yet we'' ve reached recognize just how crazy a few of these categories may be or come to be alright uh Flexibility as I stated to you earlier another dimension of every one of this besides earnings inequality as well as riches inequality we'' ve reached consider exactly how simple it is for someone to go up or drop I mean if there'' s a lot of Flexibility if you uh born into an inadequate family can extremely quickly prosper through just working as well as playing by the policies after that it'' s less of a problem than if you ' re born inadequate and you can never obtain anywhere so allow'' s take a look at Movement uh this is an inquiry for you it'' s an indeed no question we can do it quite promptly are you pleased with chances to prosper in America by working hard an of course B no go all right let'' s end the bidding there as well as see what you think extremely 73 of you claim no 27 of you claim yes this is if there'' s any kind of social compact in the USA this is kind of the essence of the social small everybody ought to be able to get in advance by striving by playing by the guidelines however if you can'' t something ' s wrong something ' s profoundly wrong I put on ' t know what remains in your heads when you state'no however allow ' s have a look at the way this inquiry has actually been answered over the last twenty years by a random sample of Americans uh well the majority of them differ with you most of them claim uh they'' re pleased with the opportunity to prosper by working hard yet interestingly if you consider the pattern line just over the last two decades the pattern line is downward as well as anybody who has actually followed polls particularly opinion polls and also they'' re flawed in all type of ways yet one point that'' s intriguing and Gallup does this rather well is that also a loss of ten percent is substantial it signals something this too we will certainly return to social Mobility by the percent of youngsters currently below I'' ve obtained to clarify again prior to I put this up as well as puzzle you we'' re mosting likely to look for each quintile each 20 of income team exactly how easy it is for the children in that revenue group to get into a greater revenue team so allow'' s simply have a look and if you really intend to look difficult what we'' re considering right here is a child born in the bottom 20 by earnings 43 of those youngsters are stuck in all-time low they never ever obtain out of the bottom 20 percent by contrast below 40 percent of the kids born in the leading 20 in the top quintile are stuck at the top they never ever leave the top they remain in the leading currently this is a photo this is these are the last latest information we have that I have self-confidence in I I believe things have transformed a little bit I'' m not exactly sure which direction yet the point is that about most other so-called Abundant Nations we currently have much less Wheelchair down or up depending on that you are birthed to in terms of your earnings class that says a lot regarding what you'' re mosting likely to remain in for the next 20 30 50 80 years so the very best means to do well in America is to be born rich hate to state it like that but it'' s unfortunately real or maybe it'' s favorably real I I just placed an analysis in uh I wear'' t understand whether it'' s unfortunate to me there are troubles connected with absence of Mobility the percent of U.S youngsters earning greater than their parents at age 30.
Now this is really essential in regards to the spirits and the feeling of justness as well as positive outlook remember I was birthed in 1946 in addition to Expense Clinton as well as and George W and also as well as Donald Trump and Dolly Parton and and Cher and also which was a time when everyone thought that they would do better as well as their children would do much better than they did as well as they were appropriate to make that assumption due to the fact that most children and after that grandchildren did far better than their parents you see exactly how that can have an impact on team psychology the nationwide understanding of the cumulative social portable as well as if that quits let'' s take an appearance let ' s have a look now we ' re discussing children birthed here we'' re increasing to 1984.Praise]
Read More
Recent Comments